
If you manage more than a handful of products on Amazon, you should be working from the Category Listing Report, also called the flat file. It lets you see and edit your whole catalog in one spreadsheet instead of clicking through listings one by one.
What is the Category Listing Report?
It is a report with all the information Amazon holds in the backend for your listings: SKUs, ASINs, pricing, category, title, bullet points and every other attribute. When you sell many products, it is the easiest way to keep everything organized.
What you can do with it
-
Make bulk updates instead of editing listings one at a time
-
Keep your listings compliant with their category requirements
-
Spot trends and opportunities across your catalog
-
Save hours of manual work
For example, if a competitor drops their price and you need to update 500 product prices, doing it by hand takes an evening. With the Category Listing Report, it takes minutes.
How to access the report
Here is how to download it from Seller Central and set it up so it is easy to work with.
-
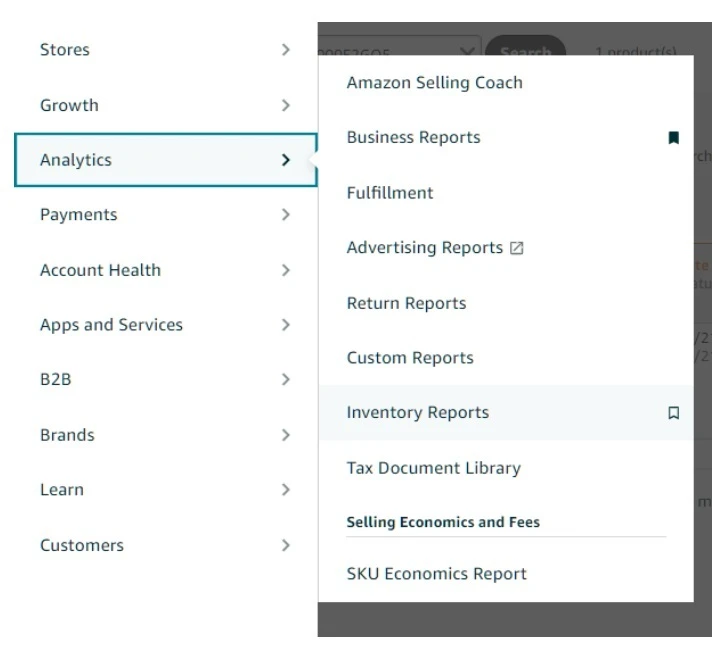
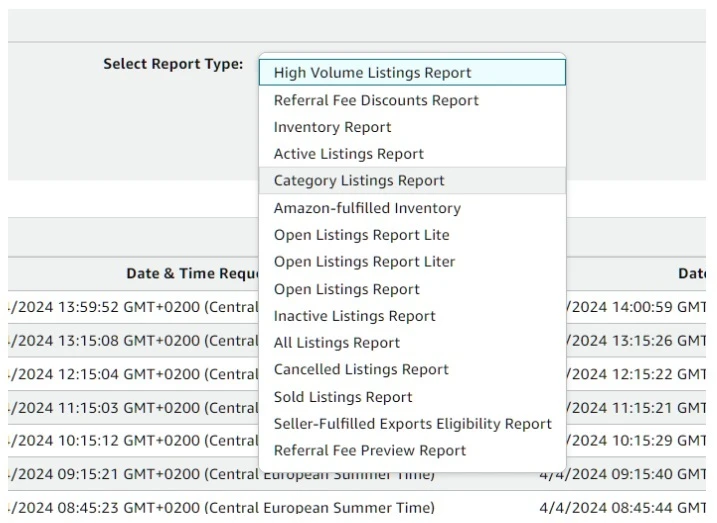
Go to your reports. Log into Seller Central, go to the Analytics section and look for Inventory Reports in the menu. This is where Amazon keeps the reports for managing your catalog.
-
Request the report. In the dropdown menu, select “Category Listings Report” and click the yellow “Request Report” button. Amazon then generates the report, which usually takes a few minutes.
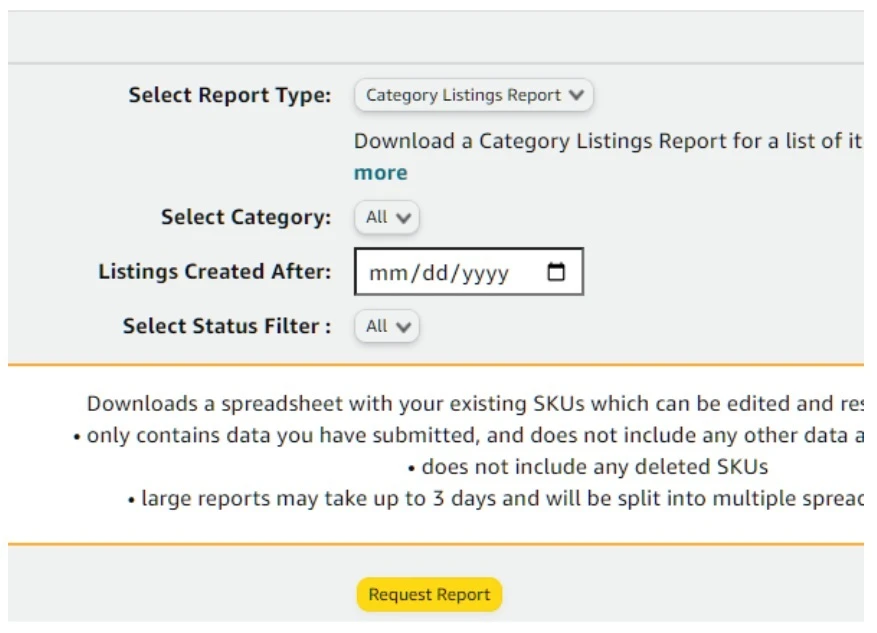

If you don’t see the Category Listings Report option
This is common and easy to fix. You need to ask Amazon to activate the report:
-
Go to the Help section in Seller Central
-
Select “Get help and resources”
-
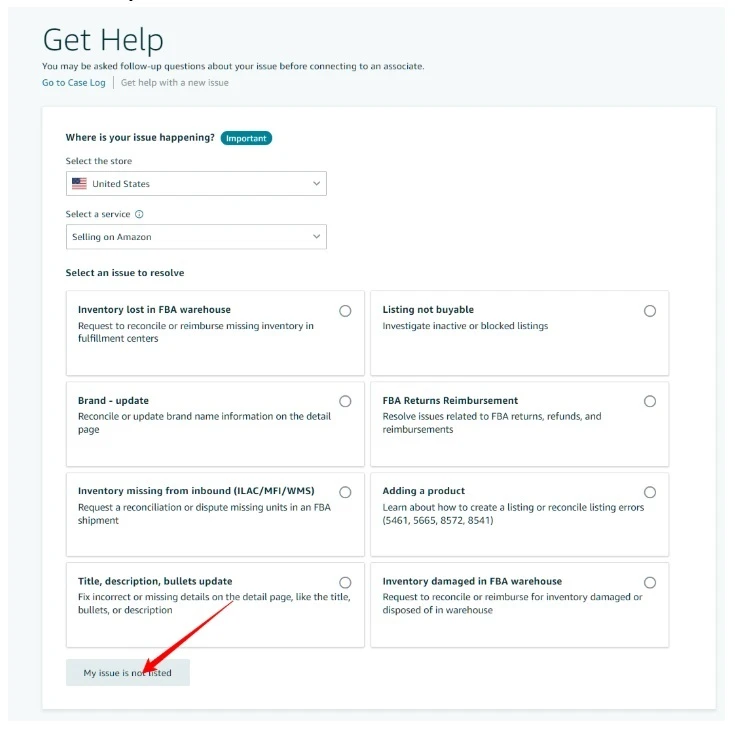
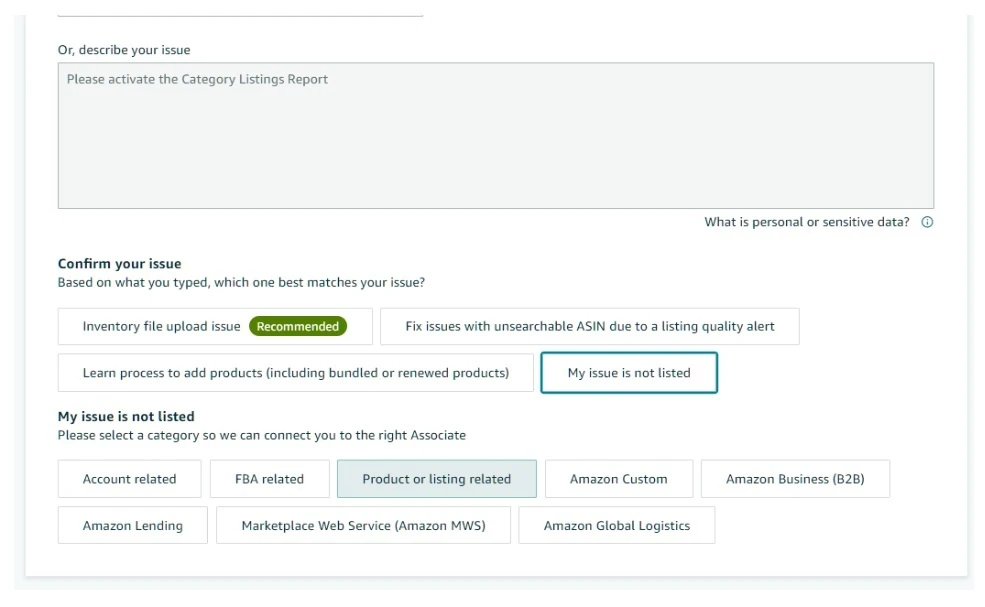
Scroll to the bottom and click “My issue is not listed”
-
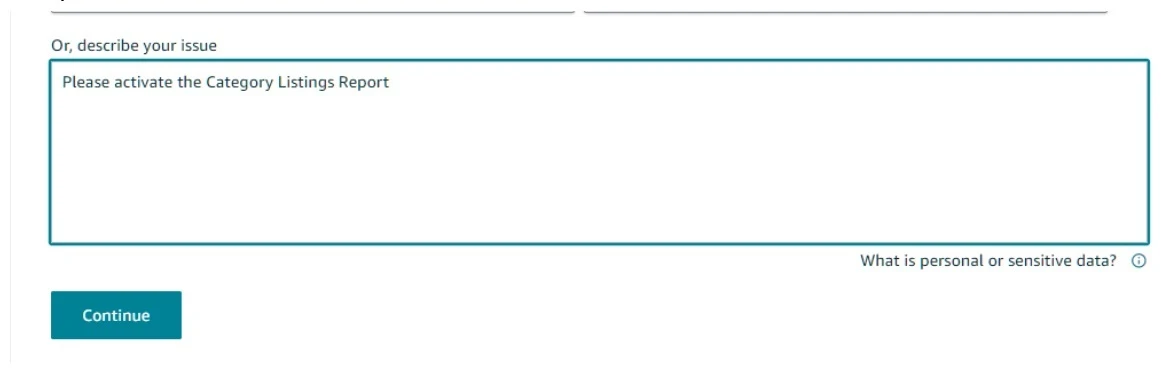
In the Description box, request the activation of the Category Listings Report
-
Click “Continue,” then “My issue is not listed” again, then “Product or Listing”
-
Choose email as your contact method and send the request
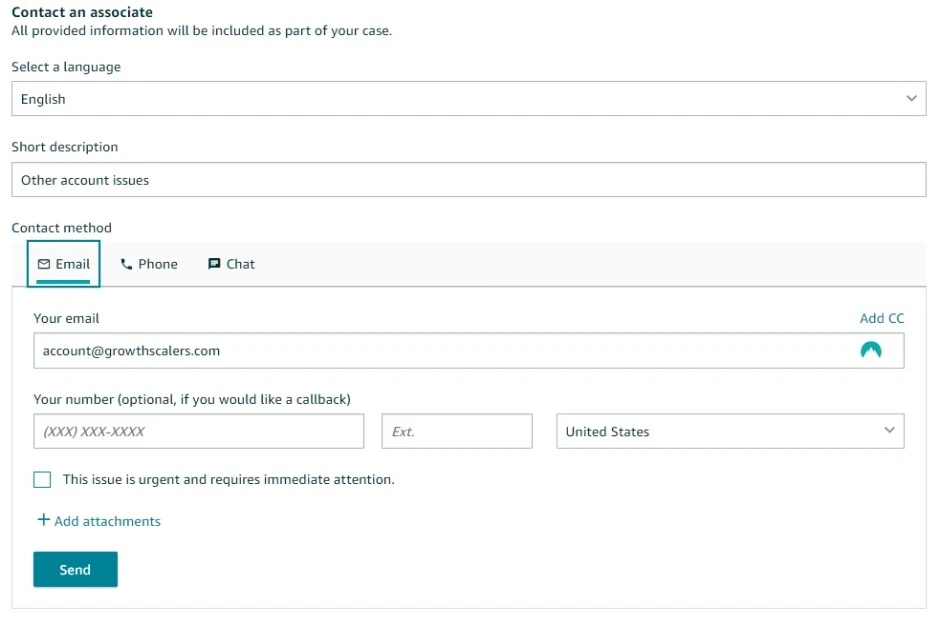
Amazon usually processes these requests within 24 hours. After that, the Category Listings Report appears in your reports dropdown.
Organizing the report
The report is large and hard to read when you first open it. Here is how we set it up.
Add filters
-
Click on cell A2
-
Press Ctrl + Shift + Arrow Down to select all the data in that column
-
While holding Ctrl + Shift, press Arrow Right to select the entire dataset
-
Click the Filter option in your spreadsheet
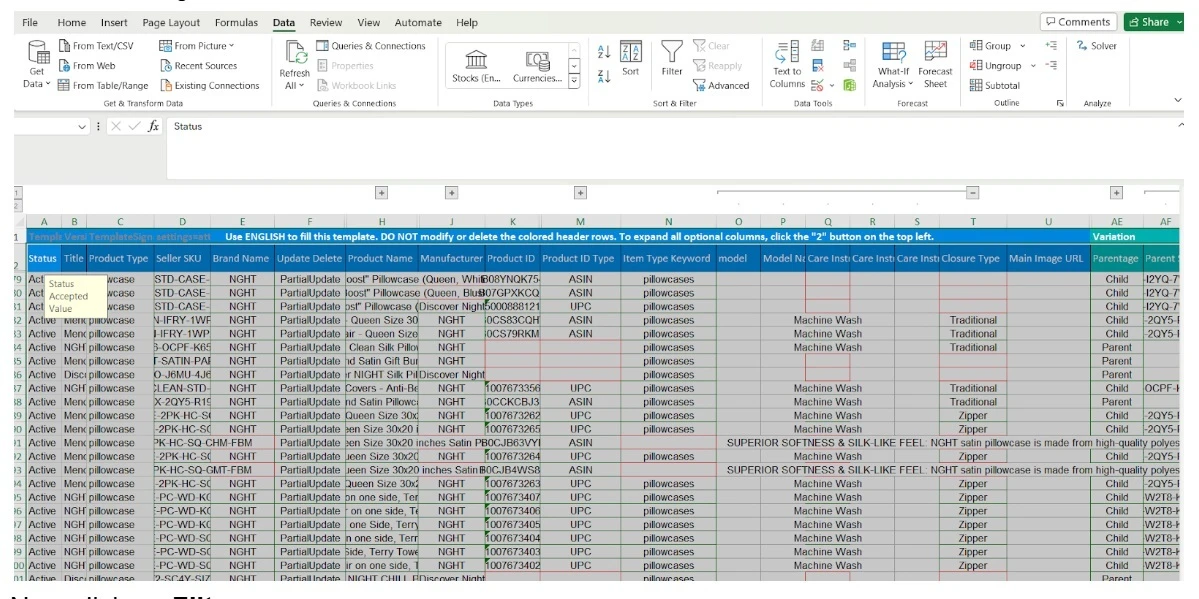
You now have a filtered view of your entire catalog that you can sort by any column.
Useful views
-
Sort by Parent SKU to group all variations together
-
Filter by Seller SKU to focus on specific products
-
Use the filtered view to find missing information or inconsistencies across listings

Last step: ungroup the columns
-
Select all cells with Ctrl + A
-
Press Alt, then A to open the Data tab
-
Press J to ungroup all columns
This way no column stays hidden or grouped while you view and edit your listings.
Before you start editing
-
Always save a backup of the original file.
-
Use Excel’s freeze panes feature so the headers stay visible while you scroll.
-
Create templates for the changes you make often.
-
Download the report regularly so you always work from current data.
Need help?
Catalog management gets complex fast when you have many products and variations. We help sellers keep their catalog organized and use these reports to make changes in bulk.
If you want a hand with your catalog, contact us.